Power Apps Running Totals In A Gallery

A running total shows the sum of all previous values in a sequence. One common example where running totals in are useful in Power Apps is when you want to display monthly sales data along with a year-to-date sum. There is not any built-in function for running totals so I will show you how to make them yourself.
Running Totals On A Single Column
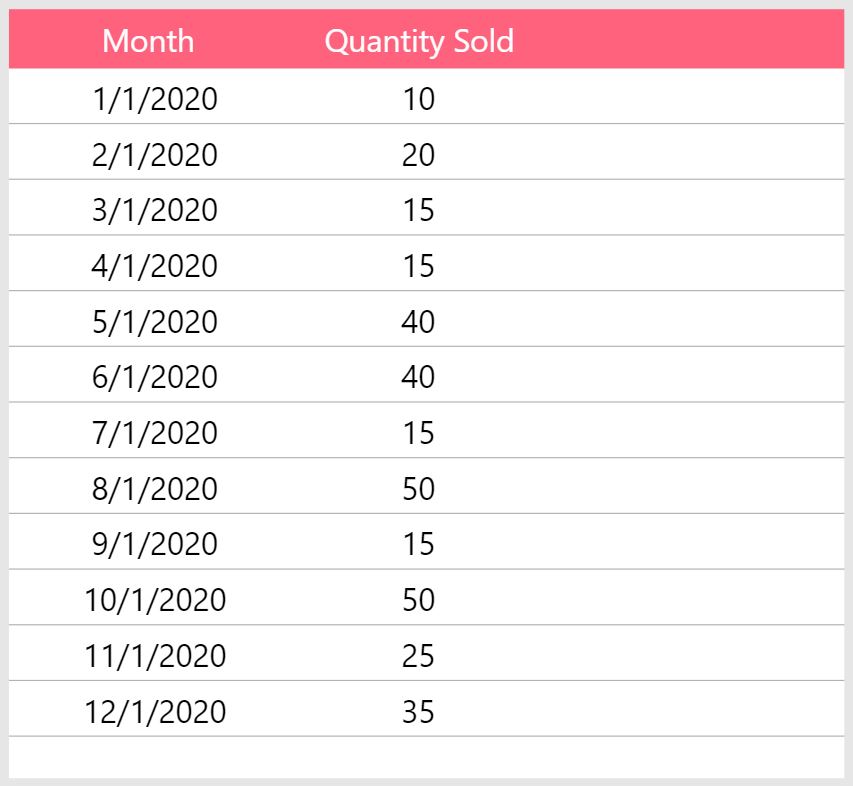
The ‘Sales By Month’ SharePoint list has two columns: Month (Date type) and QuantitySold (Number type). We want to add a running total to track the year-to-date QuantitySold.
| Month | QuantitySold |
| 1/1/2020 | 10 |
| 2/1/2020 | 20 |
| 3/1/2020 | 15 |
| 4/1/2020 | 15 |
| 5/1/2020 | 40 |
| 6/1/2020 | 40 |
| 7/1/2020 | 15 |
| 8/1/2020 | 50 |
| 9/1/2020 | 15 |
| 10/1/2020 | 50 |
| 11/1/2020 | 25 |
| 12/1/2020 | 35 |
Create a gallery in PowerApps using ‘Sales By Month’ as the datasource. Include labels showing the Month and Quantity Sold.
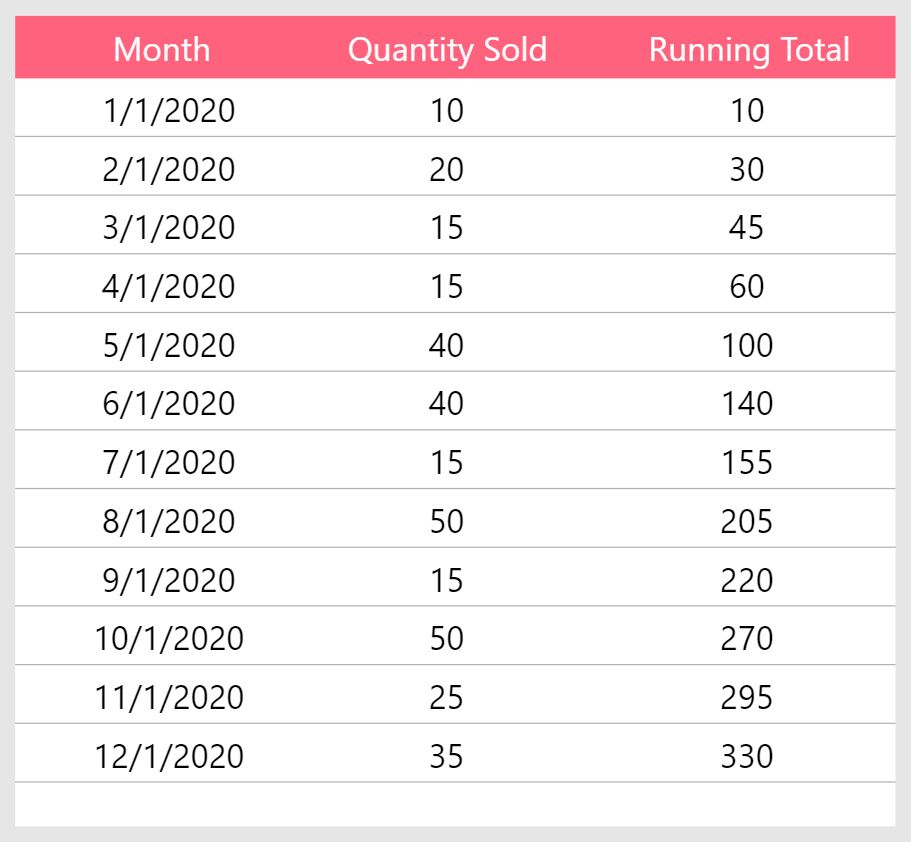
Insert another label to show the running total with this code in the Text property. You will receive a delegation warning but this is expected. The running totals will calculate properly assuming the data returned by the FILTER function is 2,000 rows or less.
Sum(Filter('Sales By Month', Month<=ThisItem.Month), QuantitySold)Code language: JavaScript (javascript)
The gallery now shows the running total.
Running Totals On Multiple Columns
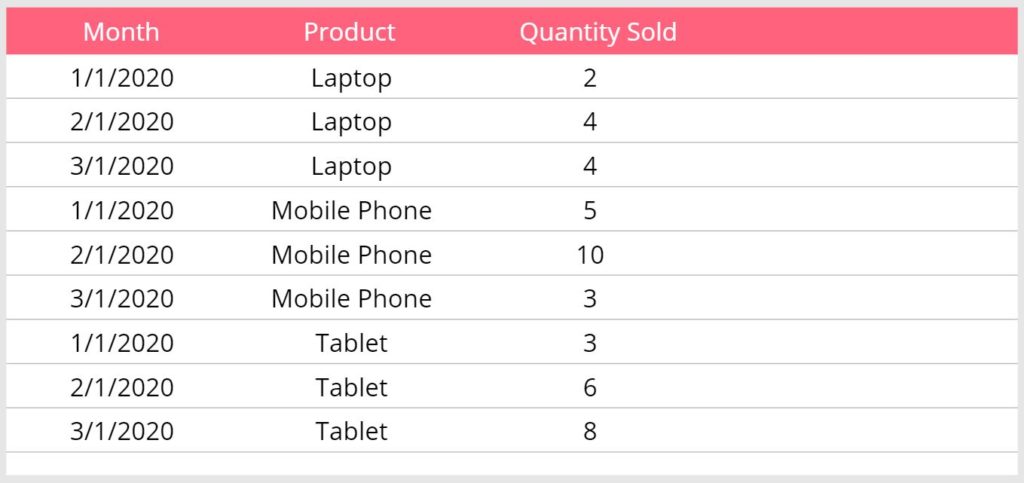
A running total can also be performed on multiple columns. Our next goal will be to create a running total for each Product sold by Month. The ‘Sales By Product’ SharePoint list shown below includes the new column Product (Text type).
| Month | Product | QuantitySold |
| 1/1/2020 | Laptop | 2 |
| 1/1/2020 | Mobile Phone | 5 |
| 1/1/2020 | Tablet | 3 |
| 2/1/2020 | Laptop | 4 |
| 2/1/2020 | Mobile Phone | 10 |
| 2/1/2020 | Tablet | 6 |
| 3/1/2020 | Laptop | 4 |
| 3/1/2020 | Mobile Phone | 3 |
| 3/1/2020 | Tablet | 8 |
Make a new gallery in PowerApps using ‘Sales By Product’ as the datasource. Place labels inside the gallery to show Month, Product and Quantity Sold.
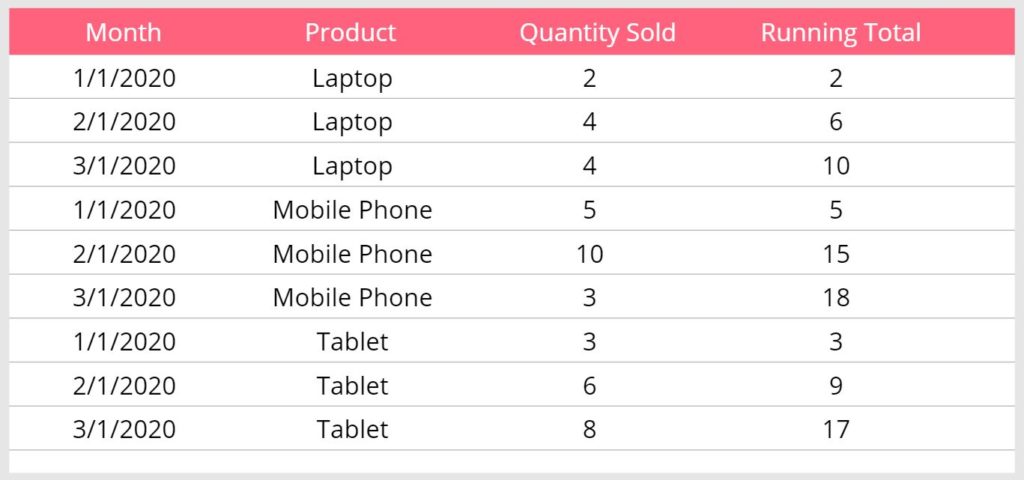
Create another label to show the running total by product and use this code in the Text property.
Sum(
    Filter('Sales By Product',
        Product=ThisItem.Product,
        Month<=ThisItem.Month
    ), QuantitySold
)Code language: JavaScript (javascript)
The final result looks like this.
Improving Performance
Calculating the running total can appear slow because Power Apps is making a separate call to the datasource for each row in gallery. The performance monitor in Power Apps Studio shows 12 responses for our 1st example: Running Totals On A Single Column.
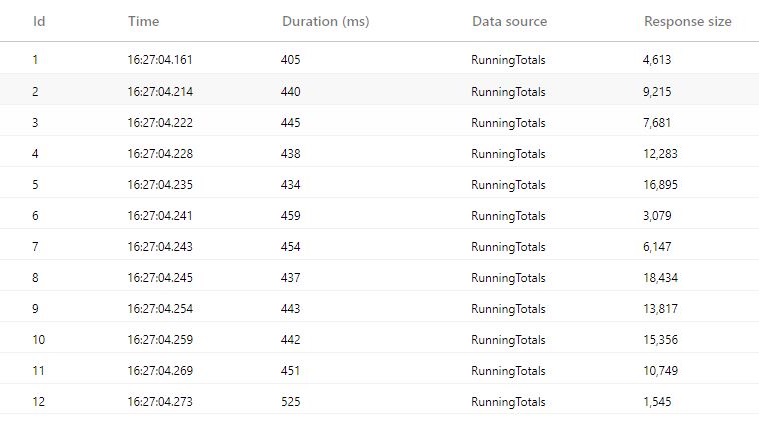
If the datasource ‘Sales By Month’ has 2,000 rows or less we can improve performance by downloading the datasource into a collection then calculating the running total on it.
// download the datasource and add a running total column
ClearCollect(colRunningTotal, AddColumns('Sales By Month',"RunningTotal",0));

// calculate the running total for each row
UpdateIf(
    colRunningTotal As Table1,
    true,
    {RunningTotal: Sum(Filter(colRunningTotal, Month<=Table1.Month), QuantitySold)}
);Code language: PHP (php)
By checking the performance monitor we can see only 1 call was made, with a shorter duration and smaller response size.

To show the running total in the gallery we insert a new label and use this code in the Text property instead.
ThisItem.RunningTotalCode language: CSS (css)
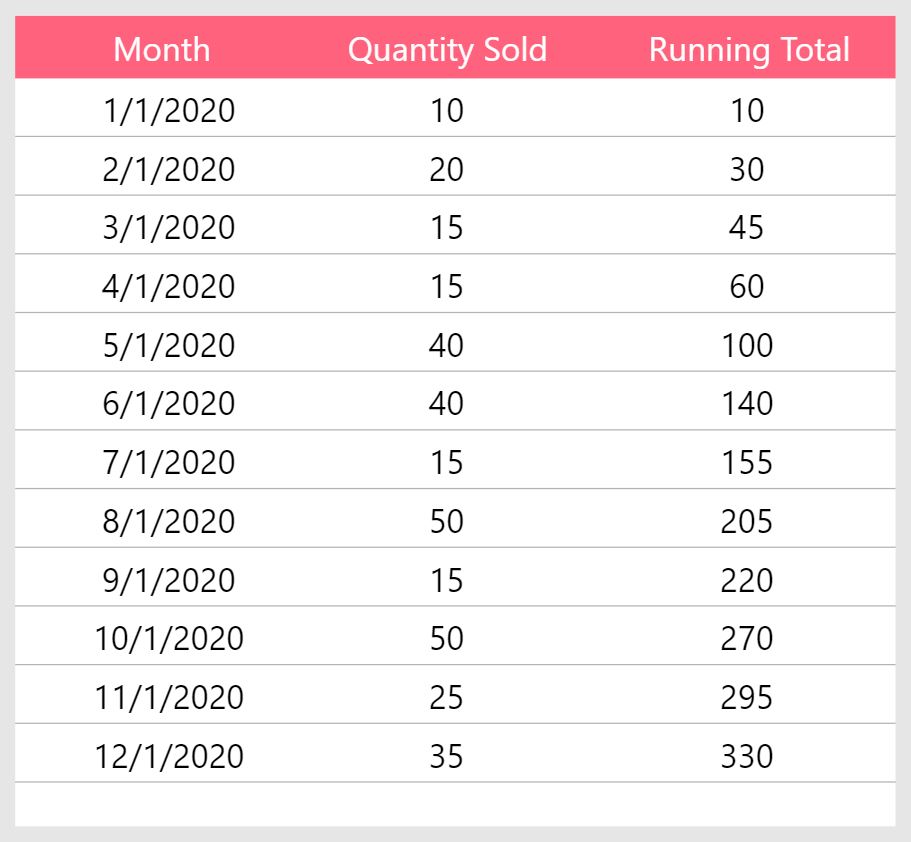
The gallery shows the same running total as before but has better performance.
Did You Enjoy This Article? 😺
Subscribe to get new Copilot Studio articles sent to your inbox each week for FREE
Questions?
If you have any questions or feedback about Power Apps Running Totals In A Gallery please leave a message in the comments section below. You can post using your email address and are not required to create an account to join the discussion.


Hi Matthew!
Where are you putting the code that is the download of the data source and adding a running total on it?
// download the datasource and add a running total column
ClearCollect(colRunningTotal, AddColumns(‘Sales By Month’,”RunningTotal”,0));
// calculate the running total for each row
UpdateIf(
colRunningTotal As Table1,
true,
{RunningTotal: Sum(Filter(colRunningTotal, Month<=Table1.Month), QuantitySold)}
);
I have a gallery that I am attempting to perform the same operation, but am not sure where the code should live.
Sarina,
I didn’t have a specific spot in mind. But you could use the OnVisible property of the form or the OnSelect property of a button.
Hi Matthew Devaney,
Thanks for the blog. I enjoy your simple solutions.
I have EMPID, LEAVE TYPE columns in a collection. I want Running totals by EMPID, LEAVE TYPE. That is, whenever EMPID LEAVETYPE combination changes, running total should reset and commence anew.
Seeking your help to achieve.
Please see attached image
Palanki,
What code have you tried so far to create a running total with this data table?
Hi Matthew Devaney,
Thanks for the blog. I enjoy your simple solutions.
I have EMPID, LEAVE TYPE columns in a collection. I want Running totals by EMPID, LEAVE TYPE. That is, whenever EMPID LEAVETYPE combination changes, running total should reset and commence anew.
Seeking your help to achieve.
Please see attached image
Apologies for wrong attachment in my first request. Deleted it later.
Hi Matthew Devaney,
Here is the correct attachment.
Hi Matthew
I’m new to Power apps, I have customized power apps form and in that a running total column, where in if the running total goes to negative, I have to update the value as 0 and restart the calculation from that item. Using If condition I’m able to update the RT as 0 but I’m struck how to reset & restart the calculation from that Item. I have attached a sample. what I’m looking for. Any help in this matter will be much appreciated.
Deepak,
Its not clear what column you are doing a running total for in this example. Please note, my method only works for a single column and it must be sorted.
Hi Matthew
Thank you for reverting.
Apology for not being so clearer in my first instance. Let me explain you in detail this time.
I have a customized power apps form with Running Total. I’m using below formula to bring value in running total column (attached screen shot and formula)
Sum(Filter(BATest3, Something<=ThisItem.Something), ‘Exertion Rating’)
– Sum(Filter(BATest3, Something<=ThisItem.Something), ‘Rest Log’)
And, I’m trying to replace to Zero if it has negative running total and restart the running total calculation from that item, any sort of solution will be really helpful.
Thanks in advance
HI Matthew,
It seems that gallery does not work well when using containers inside. Let me explain:
I have a gallery and a container inside, where a drop my controls, TextInput, DatePicker, etc. It is a responsive App.
If I run a ForAll in order to save all records from the gallery into a new collection, it creates the number of records properly but all the data is duplicated. It is like the FORALL stay getting only one line from the Gallery
Is there a way to run a FOR loop pointing to the gallery and get all records one by one, since I can identify the number of rows in the gallery.
Many thanks.
Hi Matthew, Thanks for the amazing Trainings!
I have done all the steps but can not see the RunningTotal for my lablel
Thisitem.RunningTotal doesnt show up in gallery.
have I missed something?
Neda,
Is your gallery items property set to colRunningTotal?
Did you execute this code somewhere?
// download the datasource and add a running total column
ClearCollect(colRunningTotal, AddColumns(‘Sales By Month’,”RunningTotal”,0));
// calculate the running total for each row
UpdateIf(
colRunningTotal As Table1,
true,
{RunningTotal: Sum(Filter(colRunningTotal, Month<=Table1.Month), QuantitySold)} );